Tag: design
-
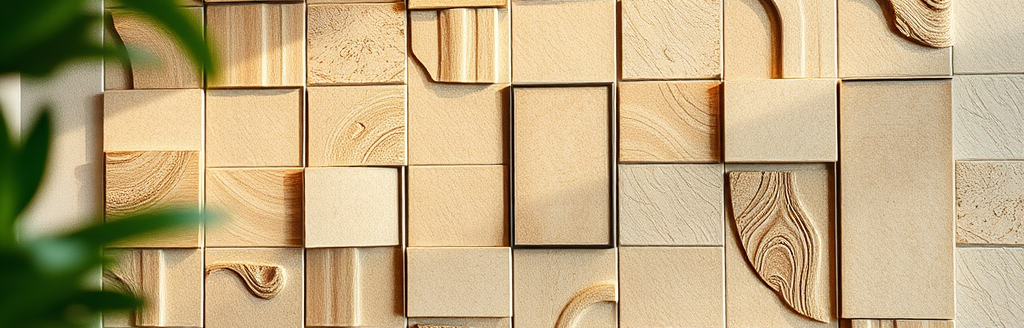
An Architects Reference: My Favorite Websites for Tile
As an architect, selecting the right materials is a critical part of designing any space. With the overwhelming number of manufacturers, products, and distributors available worldwide, finding the perfect finish can feel like a daunting task. To streamline my process, I’ve always maintained a folder of bookmarked websites—my go-to sources for different types of architectural…
-
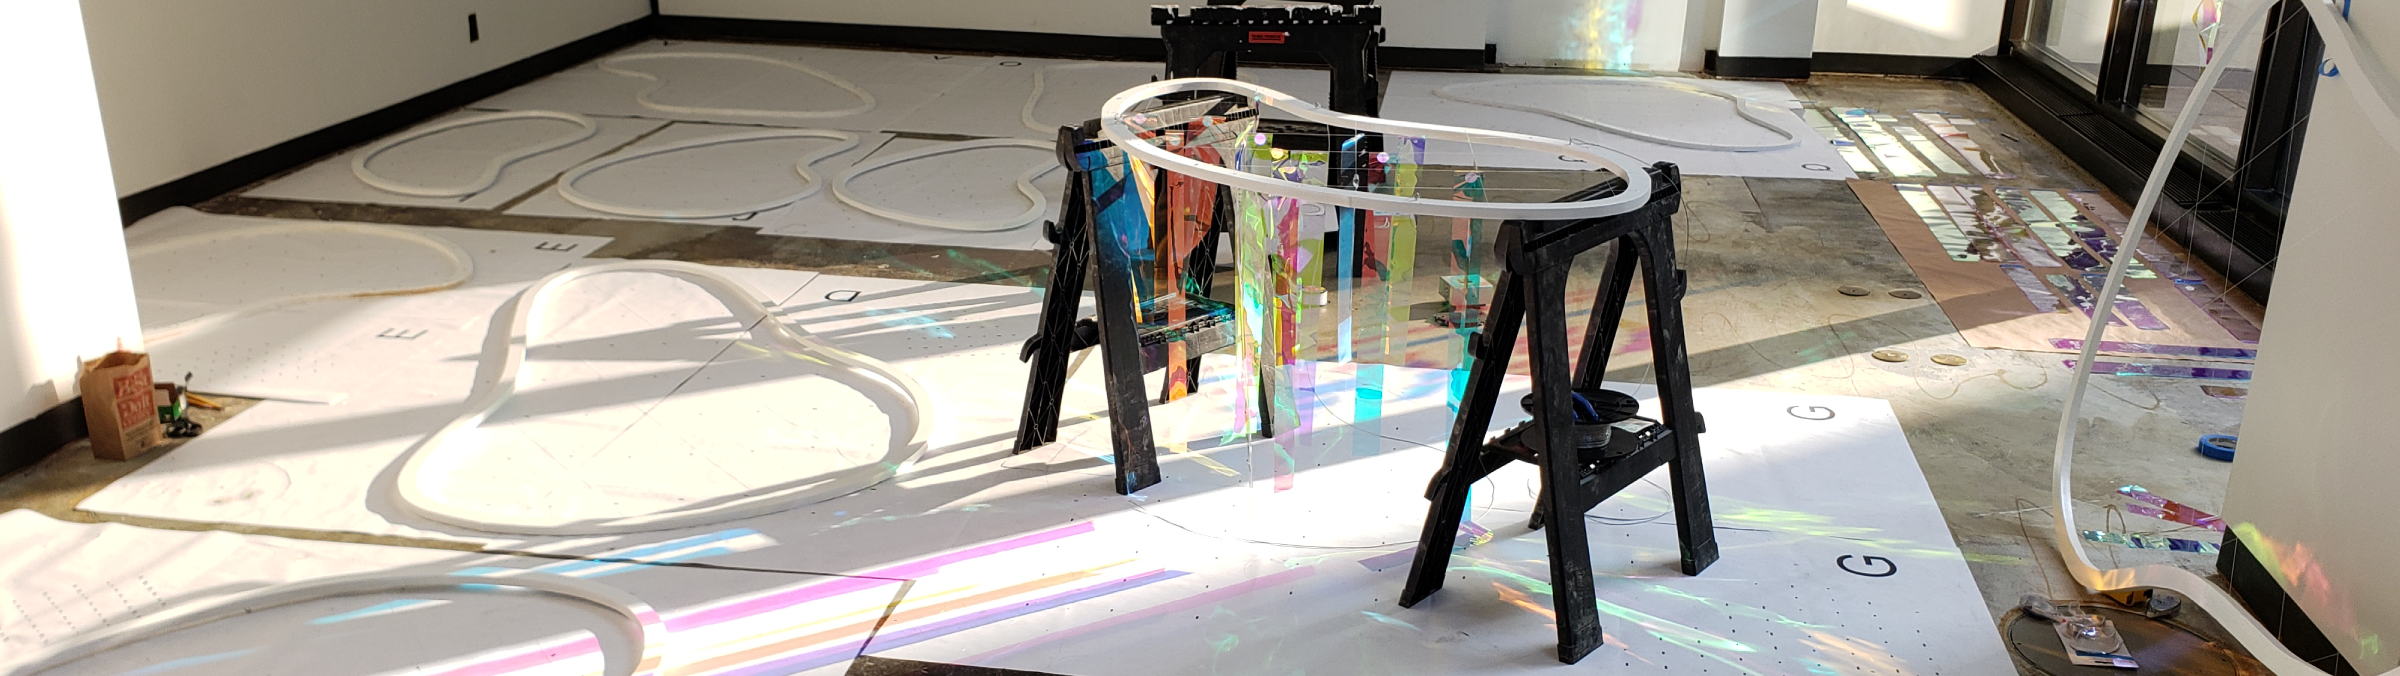
The Making of Holographic Sky
Holographic sky was created by the Design Labs Houston group at the architecture and design firm Gensler. Design labs Houston is a grassroots organization that experiments and works with future technologies and practices in the design industry. The installation was created for Transwestern as part of their artist series. For more information The Holographic Sky…
-

Create a block wall in grasshopper with random depths
Project Overview A popular design for walls and ceilings these days is to create a random assortment of blocks or other shapes that create depth to a previously flat surface. We will learn how to create a system like this in grasshopper. Create and divide the boundary surface into panels First, we need to define…
-

Design an array of geometry at various scales with curve attractors in grasshopper
Project Overview A few months ago I was asked to create a custom wall graphic for a project and it provided the perfect opportunity to use grasshopper at work. We design spaces for this company all over the country and they always have a custom design that expresses their key values at the reception of…
-

-

Tips on Getting Started with Grasshopper for Rhino
Grasshopper can be a very intimidating software to learn. The tool requires you to look at architecture as geometry and physics rather than as strictly form. This can be challenging because it requires a different mindset; however, if you can get past this hurdle, the tool can be extremely powerful. With Grasshopper, we can iterate…
-

Becoming A Digital Designer in the AEC Industry
The advent of the computer has changed how we design and build. It has created an infinite amount of potential for complexity and purpose in building design. Over the past few years, I have come to realize that architects and designers have no choice but to increase their digital understanding and skill sets if they…